
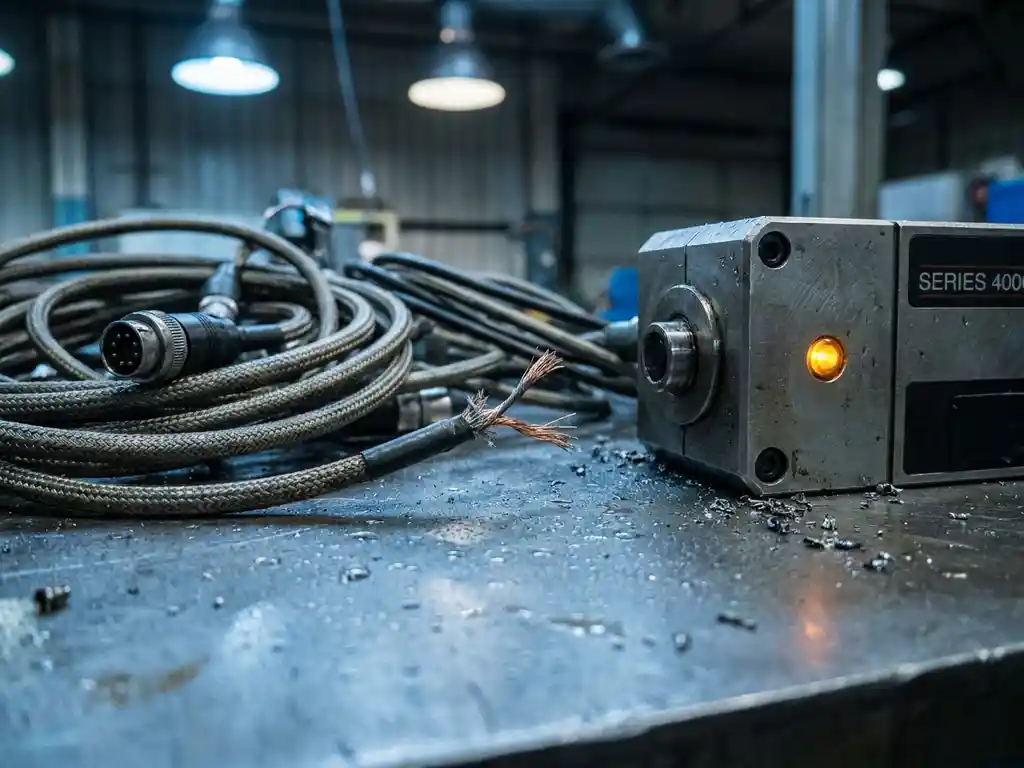
Real-time machine data is so difficult to work with because it originates in operational environments built for control and reliability, not for analytics. Industrial systems like SCADA, PLCs, and IoT sensors produce high-frequency, heterogeneous data streams using proprietary protocols that modern data platforms were never designed to ingest natively. The sections below unpack each layer of that challenge, from protocol translation to edge processing to making the data usable for ML.
Why do machines speak a different language than your data platform?
Machines speak a different language than your data platform because industrial control systems were designed decades before modern data engineering existed. They use proprietary protocols such as OPC-UA, Modbus, MQTT, and DNP3, each optimized for real-time control and fault tolerance rather than structured querying or batch analytics. Your data platform, by contrast, expects clean, typed, relational or semi-structured input arriving on predictable schedules.
This is not a solvable problem through a simple connector. Industrial protocols carry context that is fundamentally different from business data. A tag value from a PLC means nothing without the engineering unit, the asset hierarchy it belongs to, and the operational state of the machine at the time of measurement. That metadata lives in separate systems, often maintained by engineers who have never touched a data warehouse. Before a single sensor reading can be trusted in a dashboard or model, someone has to build the translation layer that bridges those two worlds.
The gap widens further because OT (operational technology) teams and IT teams have historically operated in silos. OT prioritizes uptime and safety; IT prioritizes data availability and integration. The protocols, tooling, security posture, and even organizational incentives are misaligned. Closing that gap requires more than technology. It requires deliberate architecture decisions and teams that understand both sides of the boundary.
What makes SCADA and sensor data different from regular business data?
SCADA and sensor data differ from regular business data in four fundamental ways: volume and velocity, irregular timing, context dependency, and data quality characteristics. Where a CRM might log thousands of records per day, a single production line can generate millions of time-series data points per hour, often with sub-second resolution. That volume demands different storage, ingestion, and query patterns than standard relational or columnar databases.
Irregular timing and sparse signals
Business data typically arrives on event-driven schedules, such as a sale, a login, or a form submission. Sensor data arrives on fixed polling intervals or on change-of-value triggers. Many historians only record a new value when something changes, which means gaps in the time series do not indicate missing data but rather no change. Treating those gaps as nulls during analytics produces misleading results. Interpolation logic has to be built deliberately into the pipeline.
Context dependency and engineering units
A raw sensor value of 847 means nothing without knowing the tag name, the engineering unit (RPM, bar, degrees Celsius), the asset it is attached to, and the calibration state of the sensor. Regular business data is largely self-describing. Sensor data requires an asset model or a tag dictionary to be interpretable, and that model is rarely maintained in a format that data engineers can consume directly. Building the semantic layer on top of raw machine data is a significant engineering effort that is often underestimated. Organizations looking to tackle this challenge at scale can benefit from dedicated software and data services that bring the right tooling and expertise to bear from the start.
What causes data loss and gaps in real-time machine streams?
Data loss and gaps in real-time machine streams are caused by network instability in plant environments, buffer overflows in edge collectors, protocol-level filtering in historians, and unplanned downtime in both machines and data infrastructure. Unlike cloud-native SaaS data, machine data travels through layers of industrial networking, including field buses, SCADA servers, and DMZ firewalls, each of which can introduce latency, packet loss, or outright data drops.
Historians, which are the time-series databases embedded in most SCADA systems, apply compression algorithms by default. These algorithms discard data points that fall within a defined deviation threshold from the previous value. This is efficient for storage but destructive for analytics use cases where small variations matter, such as predictive maintenance or quality control. Data engineers pulling from historians often receive a compressed, lossy version of reality without realizing it.
Network partitions between the OT zone and the IT zone are another common source of gaps. When connectivity drops, edge collectors typically buffer data locally, but buffer sizes are finite. If the outage lasts long enough, data is permanently lost. Robust pipeline design accounts for this by implementing local buffering with replay capability, dead-letter queues for failed messages, and gap detection logic that flags missing intervals rather than silently skipping them.
How does OT-IT integration actually work in practice?
OT-IT integration works in practice by establishing a secure, structured data pathway from industrial control systems through a demilitarized zone (DMZ) and into the IT data infrastructure, using protocol translation at the edge and standardized data contracts at the boundary. The integration is never a direct connection between a PLC and a cloud data platform. It is a layered architecture with clear handoff points.
In practice, the first layer is an edge collector or industrial gateway that reads from native OT protocols and converts them into a transport-friendly format such as MQTT or OPC-UA. That gateway sits inside the OT network or in a DMZ and handles the real-time polling. The second layer is a message broker, often Apache Kafka or a cloud-native equivalent, that decouples the OT source from the IT consumers and provides buffering, replay, and fan-out capabilities.
From the broker, data flows into the data platform through ingestion pipelines that apply schema validation, unit normalization, and asset context enrichment. This is where data engineering work becomes critical: building the transformations that turn raw tag streams into structured, queryable datasets. Security is non-negotiable throughout. OT networks carry safety-critical systems, and any integration must be designed with unidirectional data flows, strict firewall rules, and OT-specific security standards such as IEC 62443 in mind.
We work through exactly this architecture in manufacturing, energy, and agritech environments, building the OT-IT bridge as a production-grade pipeline rather than a proof-of-concept integration. Our managed services ensure that these pipelines remain reliable, monitored, and maintained long after the initial build.
When should real-time machine data be processed at the edge versus the cloud?
Real-time machine data should be processed at the edge when latency requirements are below one second, when bandwidth constraints make full data transmission impractical, or when local action must be triggered without cloud dependency. It should be processed in the cloud when the use case requires historical context, cross-asset correlation, or model training that demands compute resources unavailable at the edge.
The decision is not binary. Most production architectures use a tiered approach. At the edge, lightweight processing handles anomaly detection, threshold alerting, and data reduction, such as aggregating ten-millisecond readings into one-second summaries before transmission. In the cloud or on-premise data platform, the aggregated and enriched data supports longer-horizon analytics, machine learning model training, and cross-plant benchmarking.
Latency is the clearest driver. A safety interlock that must respond in milliseconds cannot depend on a round trip to a cloud API. But a predictive maintenance model that scores equipment health over rolling 30-day windows does not need edge compute. Bandwidth cost is the second driver. Transmitting raw high-frequency sensor data from hundreds of assets continuously is expensive. Edge aggregation and filtering reduce that cost dramatically while preserving the signal quality needed for most analytics use cases.
What does it take to make machine data actually usable for analytics and ML?
Making machine data usable for analytics and ML requires four things: reliable ingestion with gap detection, semantic enrichment through an asset model, data quality enforcement in the pipeline, and a storage layer optimized for time-series query patterns. Without all four, data scientists receive raw tag streams they cannot interpret, models trained on incomplete data, and dashboards that business users do not trust.
Semantic enrichment is the step most often skipped. A column named tag_847_value is useless to an ML engineer. That tag needs to be mapped to an asset, a location, an engineering unit, and a process context before it can be used as a feature. Building and maintaining that asset model, and keeping it synchronized with physical changes on the plant floor, is an ongoing data engineering responsibility, not a one-time setup task.
Data quality enforcement must be built into the pipeline, not applied as a post-hoc audit. This means schema validation at ingestion, range checks against engineering limits, freshness monitoring that alerts when a feed goes silent, and lineage tracking that records where each value came from and what transformations it passed through. These are the foundations that allow an ML team to train models they can trust and allow compliance teams to satisfy requirements such as the EU AI Act’s traceability obligations.
Storage architecture matters too. Standard columnar formats like Parquet work well for batch analytics, but time-series query patterns, such as resampling, windowing, and point-in-time lookups, benefit from purpose-built time-series databases or lakehouse table formats with time-partitioning strategies. Choosing the right storage layer for the query patterns your teams actually use is a decision that pays dividends every day the platform runs.
If your team is dealing with machine data that is not yet reliable or queryable, talk to our data engineers about where to start. We build these pipelines in production, not on whiteboards.
Frequently Asked Questions
Where should we start if our machine data is currently going nowhere — no historian, no pipeline, no structure?
Start with a data audit at the source: identify every asset, its communication protocol, polling frequency, and the team responsible for it. Before building any pipeline, you need a clear inventory of what data exists, in what format, and what decisions it needs to support. From there, a minimal viable architecture — an edge collector feeding a message broker with basic schema validation — gives you a working foundation to build on incrementally, without requiring a full platform overhaul on day one.
How do we handle historian compression if we can't bypass it at the source?
If you cannot disable or reduce historian compression at the source (which OT teams are often reluctant to allow), the practical workaround is to configure your edge collector to read directly from the PLC or field device at a higher frequency, bypassing the historian entirely for the tags that matter most to your analytics use cases. Where direct access is not possible, document the compression algorithm and its deviation threshold so downstream pipelines and ML teams know exactly what fidelity they are working with — a known limitation is far less dangerous than an unknown one.
What is the most common mistake teams make when building their first OT-IT integration?
The most common mistake is treating the integration as a one-time connector project rather than an ongoing data product. Teams often succeed in getting data flowing, then discover months later that asset changes on the plant floor have broken tag mappings, new machines are not included, and no one owns the maintenance of the semantic layer. Designing the integration with change management in mind from the start — including versioned data contracts, automated gap detection, and a clear ownership model between OT and IT teams — prevents the pipeline from silently degrading over time.
What if our OT team is resistant to sharing access to control system data?
OT resistance is almost always rooted in legitimate concerns about uptime risk and security, not obstruction. The most effective approach is to start with read-only access to a non-critical asset or a historian export, rather than asking for direct PLC connectivity upfront. Demonstrating a working, secure proof of concept on a low-risk data stream builds the trust needed to expand scope. Aligning on OT-specific security standards like IEC 62443 and involving the OT team in architecture decisions — rather than presenting them with a finished design — also significantly reduces friction.
How do we know which sensor tags are actually worth ingesting, given that there can be thousands of them?
Start with the business or operational question you are trying to answer, then work backwards to the tags that are causally relevant to it. Ingesting everything by default is tempting but creates storage costs, pipeline complexity, and semantic noise that slows down analytics teams. A structured tag prioritization exercise — involving process engineers, data scientists, and business stakeholders — typically reduces the initial scope by 60–80% while covering the vast majority of analytical value. You can always expand coverage incrementally as use cases mature.
Can standard data quality tools like Great Expectations or dbt tests be applied to machine data pipelines?
Yes, but they need to be adapted for time-series characteristics that standard business data tools do not handle natively. Great Expectations can enforce schema validation and range checks at ingestion, and dbt tests work well for transformed, structured datasets downstream. However, you will need custom logic for time-series-specific quality checks such as freshness monitoring, gap detection, interpolation validation, and sensor drift alerts. These are best implemented as dedicated pipeline steps before data reaches the transformation layer, so quality issues are caught and flagged as close to the source as possible.
How do we meet EU AI Act traceability requirements when our training data comes from machine streams?
The EU AI Act requires that training data for high-risk AI systems be documented with sufficient detail to assess its quality, origin, and any transformations applied. For machine data pipelines, this means implementing end-to-end lineage tracking that records the source tag, the collection timestamp, the edge processing steps, any aggregations or interpolations applied, and the version of the asset model used for semantic enrichment. Tools like Apache Atlas, OpenLineage, or lakehouse-native lineage features can automate much of this, but the pipeline architecture must be designed with lineage as a first-class output from the beginning — retrofitting it later is significantly more costly.