
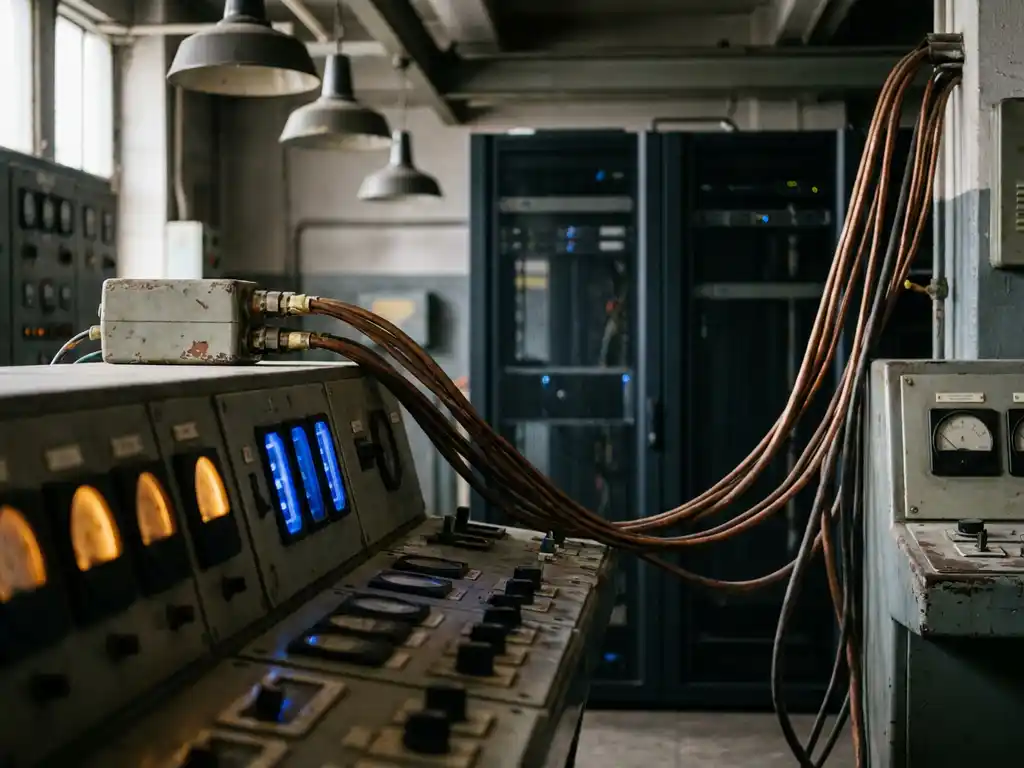
Integrating SCADA systems into a modern data platform means building a secure, reliable bridge between your operational technology (OT) environment and your IT data infrastructure, so that real-time sensor readings, control events, and historian archives become first-class citizens alongside your ERP, CRM, and other enterprise data. The key is not just moving the data, but normalizing it, contextualizing it, and making it trustworthy enough for analytics and machine learning. The sections below unpack the most important questions engineers and data leads face when tackling this challenge.
What makes SCADA data different from conventional enterprise data?
SCADA data is fundamentally different from conventional enterprise data because it is time-series by nature, generated at very high frequency by physical sensors and control systems, and carries strict latency and reliability constraints that typical business data never demands. Unlike a CRM record updated a few times a day, a SCADA system may emit thousands of tag values per second, each tied to a precise timestamp and an engineering unit.
A few characteristics set SCADA data apart from what most data engineers encounter in standard enterprise pipelines:
- Volume and velocity: Industrial sensors produce continuous streams of readings. A mid-size manufacturing plant can generate millions of data points per hour across hundreds of tags.
- Proprietary protocols: SCADA systems communicate over OPC-UA, Modbus, DNP3, or vendor-specific formats rather than REST APIs or SQL endpoints. Getting the data out requires protocol-aware connectors, not a simple JDBC driver.
- Historian databases: Raw SCADA values are typically stored in time-series historians such as OSIsoft PI or Wonderware, which compress and store data in ways that require specialized extraction logic.
- Context dependency: A raw tag value like 0.87 is meaningless without knowing which asset it belongs to, what engineering unit applies, and what the normal operating range is. Contextualizing SCADA data requires linking it to an asset hierarchy or equipment master.
- Operational criticality: SCADA systems control physical processes. Any integration that touches the OT network must be designed with safety and availability as non-negotiable constraints.
Understanding these differences is the first step toward designing a data engineering approach that actually works in an industrial setting, rather than one borrowed from a SaaS-first environment where none of these constraints exist.
How does OT/IT integration actually work in practice?
OT/IT integration works in practice by establishing a controlled, unidirectional or bidirectional data flow between the operational technology layer and the IT data platform, typically through a demilitarized zone (DMZ) that separates the two networks while allowing structured data transfer. The goal is to extract operational data without exposing control systems to IT-side risk.
The typical architecture follows a layered approach:
- Edge collection: A lightweight data collector or industrial gateway sits close to the SCADA system or historian and reads tag data using OPC-UA or another supported protocol. This component translates proprietary signals into a standardized format such as JSON or Parquet.
- Network segmentation: Data crosses from the OT network to the IT network through a DMZ. Firewalls enforce strict rules: data flows from OT to IT, never the other way around, unless there is a deliberate and audited control path.
- Message broker or streaming layer: Tools like Apache Kafka or Azure Event Hubs receive the translated data stream and buffer it, providing resilience against downstream processing delays and enabling multiple consumers to subscribe to the same feed.
- Ingestion and normalization: A data engineering pipeline picks up the stream, applies unit conversions, maps tags to asset identifiers, and writes the normalized data into the platform’s landing zone.
- Contextualization: The raw time-series data is enriched with metadata from the equipment master or digital twin, making it queryable and meaningful to analysts who were not involved in the original SCADA configuration.
In practice, the hardest part is not the technology selection but the alignment between OT teams, who prioritize uptime and safety, and IT teams, who prioritize flexibility and agility. Successful integrations treat the OT engineers as equal stakeholders from the start, not as gatekeepers to be worked around. Organizations that want to accelerate this process often benefit from managed services that bring both OT and IT expertise under one roof.
Which data platform architecture fits SCADA workloads best?
A lakehouse architecture is generally the best fit for SCADA workloads because it combines the low-cost, high-volume storage of a data lake with the query performance and ACID transaction support of a data warehouse, which is exactly what time-series industrial data demands at scale. It avoids the duplication and synchronization overhead that comes with maintaining separate lake and warehouse layers.
Here is how the main architectural options compare for industrial data engineering scenarios:
Lakehouse
A lakehouse built on Delta Lake, Apache Iceberg, or Apache Hudi stores raw SCADA historian exports alongside processed and curated layers in a single storage tier. Open table formats allow time-travel queries, which are valuable when you need to reconstruct what the plant looked like at a specific moment for root-cause analysis or compliance reporting. Platforms like Databricks, Microsoft Fabric, and Snowflake all support this pattern with varying degrees of native time-series optimization.
Data mesh
A data mesh approach makes sense when SCADA data spans multiple plants, business units, or geographic regions, each with its own ownership model. In a mesh, each domain team publishes its operational data as a product with agreed quality standards and contracts. This architectural pattern works well for large industrial enterprises but requires significant organizational maturity and clear data ownership structures before it delivers value.
Regardless of the overarching architecture, SCADA workloads almost always benefit from a dedicated time-series storage layer, either a purpose-built time-series database like InfluxDB or TimescaleDB for high-frequency raw data, or the time-series optimization features now available in cloud data platforms. The lakehouse then sits above this layer, holding contextualized, enriched data ready for analytics and machine learning.
What are the main challenges when building SCADA data pipelines?
The main challenges when building SCADA data pipelines are protocol diversity, data quality at the source, timestamp alignment, and the organizational gap between OT and IT teams. Each of these can derail a pipeline that looks straightforward on a whiteboard but breaks down the moment it meets a real factory floor.
- Protocol and format diversity: A single plant may run multiple SCADA vendors, each with its own protocol and historian. Building a unified ingestion layer means handling OPC-UA, Modbus, MQTT, and proprietary APIs simultaneously, often with different polling frequencies and reliability guarantees.
- Timestamp and clock synchronization: Industrial devices do not always have synchronized clocks. Timestamp drift between sensors, PLCs, and historians creates subtle but serious data quality problems, especially when joining SCADA data with ERP or MES records that carry their own timestamps.
- Data quality at the source: Sensor faults, communication dropouts, and calibration drift produce outliers, null values, and physically impossible readings. A data engineering pipeline that does not detect and handle these upstream will silently corrupt downstream analytics and machine learning models.
- Schema evolution: SCADA configurations change when equipment is added, replaced, or reconfigured. Tags are renamed, retired, or reassigned. Pipelines that are not designed to handle schema drift will break silently or produce misleading results.
- OT/IT organizational friction: OT teams are responsible for production continuity and are rightfully cautious about changes to network configurations or system access. Data engineers who underestimate this dynamic will find integration projects stalling at the network boundary rather than at the code level.
Addressing these challenges requires both technical depth and the ability to work across organizational boundaries, which is why OT/IT integration projects tend to move faster when a single team holds accountability for both the engineering and the stakeholder alignment. A strong software and data practice that understands both sides of the equation makes a measurable difference here.
How do you ensure SCADA pipeline reliability and observability?
You ensure SCADA pipeline reliability and observability by building monitoring, alerting, and data quality checks directly into the pipeline rather than treating them as an afterthought. A SCADA pipeline that fails silently is more dangerous than one that fails loudly, because operational decisions may continue to be made on stale or corrupted data without anyone realizing it.
Practical measures that make a meaningful difference include:
- Ingestion lag monitoring: Track the time between a sensor event and its arrival in the data platform. Alert when lag exceeds a defined threshold, which indicates a connectivity issue, a broker backlog, or a pipeline bottleneck before it becomes a business problem.
- Data freshness checks: For each critical tag or asset group, assert that new data has arrived within the expected window. A tag that stops updating is often a sign of a sensor fault or a network disruption, not a quiet period in the process.
- Statistical anomaly detection: Flag readings that fall outside physically plausible ranges or that deviate sharply from historical distributions. This catches sensor drift and calibration issues before they propagate into analytics.
- Pipeline lineage tracking: Maintain end-to-end lineage from the historian source through every transformation to the final data product. When a downstream report shows an unexpected value, lineage lets you trace it back to the source in minutes rather than hours.
- Dead letter queues and replay capability: Design the pipeline to capture failed or malformed messages in a dead letter queue rather than discarding them. The ability to replay historical data is essential when a bug is discovered after the fact.
Tools like dbt tests, Great Expectations, Monte Carlo, or platform-native observability features in Databricks and Snowflake all support these patterns. The right tooling matters less than the discipline of treating observability as a first-class engineering requirement from day one. Our data engineering practice builds these checks into every pipeline we deliver, because a pipeline without observability is not a production-ready pipeline.
What security and compliance requirements apply to SCADA data integration?
SCADA data integration must meet both OT-specific security standards and broader IT compliance frameworks, including NIS2 in the European Union, IEC 62443 for industrial cybersecurity, and increasingly the EU AI Act when SCADA data feeds machine learning systems used in critical infrastructure or high-risk processes. These requirements are not optional and are becoming more actively enforced in 2026.
Network and access security
The OT network must remain isolated from general IT access. Data extraction should flow through a hardened DMZ with strict firewall rules, and all data in transit must be encrypted. Access to SCADA systems should follow the principle of least privilege, with dedicated service accounts that have read-only permissions scoped to specific tags or historian namespaces. Any change to network configuration in the OT zone must go through a formal change management process that includes sign-off from the OT engineering team.
Compliance and audit requirements
NIS2 requires organizations operating critical infrastructure to implement risk management measures, incident reporting, and supply chain security controls that explicitly cover OT environments. This means your data integration architecture must be documented, auditable, and tested against failure scenarios. IEC 62443 provides a more granular framework for securing industrial automation and control systems, and its zone-and-conduit model maps well onto the DMZ-based integration architecture described earlier.
For organizations whose SCADA data feeds AI models used in process optimization or predictive maintenance, the EU AI Act introduces additional obligations around data quality, model documentation, and human oversight for systems classified as high-risk. Building data lineage and quality controls into the pipeline from the start is not just good engineering practice; it is increasingly a compliance requirement.
If you are navigating these requirements and want to understand how they apply to your specific architecture, speaking with an engineer who works in this space daily is the fastest way to get clarity on what your integration needs to cover.
Frequently Asked Questions
How do I get started with a SCADA data integration project if my OT and IT teams have never worked together before?
Start with a discovery workshop that brings OT engineers, data engineers, and IT security together to map the existing SCADA landscape, identify available protocols, and agree on a shared risk tolerance. Pick a single plant or a small set of high-value tags as a pilot scope rather than attempting a full integration from day one. A narrow, successful pilot builds trust between teams and surfaces the organizational and technical friction points you will need to resolve before scaling. From there, document the agreed architecture, ownership boundaries, and change management process before writing a single line of pipeline code.
What is the difference between polling and event-driven data collection from a SCADA historian, and which should I use?
Polling means your collector queries the historian on a fixed schedule, pulling whatever values have accumulated since the last run, while event-driven collection means the SCADA system or historian pushes data to your collector as changes occur, typically using OPC-UA subscriptions or MQTT. Event-driven collection is generally preferred for high-frequency tags because it reduces latency and avoids the over- or under-sampling that polling intervals introduce. However, many legacy historians only support polling, so the right answer depends on what your specific historian and protocol stack actually support. A hybrid approach, event-driven for critical real-time tags and scheduled batch extraction for historical backfill, is common in practice.
How should I handle missing or null values in SCADA data without distorting my analytics?
First, distinguish between the different causes of missing data: a sensor fault, a communication dropout, a planned shutdown, or a historian compression artifact each require a different treatment. Tag gaps caused by historian compression, where the historian only records a value when it changes beyond a threshold, should be forward-filled or interpolated using the historian’s own retrieval API rather than treated as true nulls. For genuine sensor faults or communication outages, preserve the null and add a data quality flag column so downstream consumers can filter or impute appropriately rather than unknowingly training models on fabricated values. Never silently drop or fill missing values without documenting the logic in your pipeline and surfacing the quality flag to analysts.
Can I use a standard cloud data warehouse like Snowflake or BigQuery for SCADA data, or do I need a dedicated time-series database?
You can use a cloud data warehouse for SCADA data, but whether it is sufficient depends on the query patterns and data volumes involved. For analytics, reporting, and machine learning feature engineering on contextualized, enriched SCADA data, Snowflake, BigQuery, and similar platforms work well and avoid the operational overhead of managing a separate time-series database. Where they struggle is with very high-frequency raw ingestion at millisecond resolution and time-series-specific query functions like downsampling, gap-filling, and range queries across thousands of tags simultaneously. A practical pattern is to use a purpose-built time-series database such as InfluxDB or TimescaleDB as the high-frequency landing layer, then move aggregated and contextualized data into the cloud data warehouse or lakehouse for broader analytical use.
What is the biggest mistake teams make when modeling SCADA data in a lakehouse?
The most common and costly mistake is storing raw tag values in a wide, pivot-style table with one column per tag, which seems intuitive but becomes unmanageable as soon as tags are added, renamed, or retired. The schema breaks, historical comparisons become unreliable, and every new sensor requires a schema migration. The better approach is a narrow, entity-attribute-value or tall-table model where each row represents a single tag reading with columns for asset ID, tag name, timestamp, value, engineering unit, and quality flag. This model accommodates schema evolution gracefully, supports efficient time-series queries with proper partitioning, and makes it straightforward to join SCADA readings with equipment metadata from an asset hierarchy.
How do I convince OT stakeholders to allow data extraction from systems they are responsible for keeping running?
Frame the integration in terms of outcomes that matter to OT teams, such as earlier detection of equipment degradation, reduced unplanned downtime, and faster root-cause analysis after incidents, rather than leading with the IT or analytics value proposition. Demonstrate that the architecture is read-only and unidirectional, with no path for IT-side systems to send commands back into the OT network, which directly addresses the availability and safety concerns that make OT engineers cautious. Involve OT engineers in reviewing the network segmentation design and change management process so they are co-owners of the solution rather than subjects of it. A formal pilot with a defined rollback plan and agreed success criteria is usually the most effective way to earn trust before expanding scope.
How often should SCADA data pipelines be tested, and what should those tests cover?
SCADA pipelines should be tested continuously in production through automated data quality checks, not just at deployment time. At minimum, your test suite should cover data freshness assertions per tag group, value range validation against physically plausible operating limits, timestamp monotonicity checks to catch clock synchronization issues, and row count reconciliation between the source historian and the landing zone. Schema drift tests that alert when a new tag appears or an existing tag stops reporting are equally important given how frequently SCADA configurations change. Beyond automated checks, run a full end-to-end integration test against a staging environment whenever a pipeline component, network configuration, or upstream SCADA system changes, and maintain a documented replay procedure so you can recover cleanly from any failure window.