
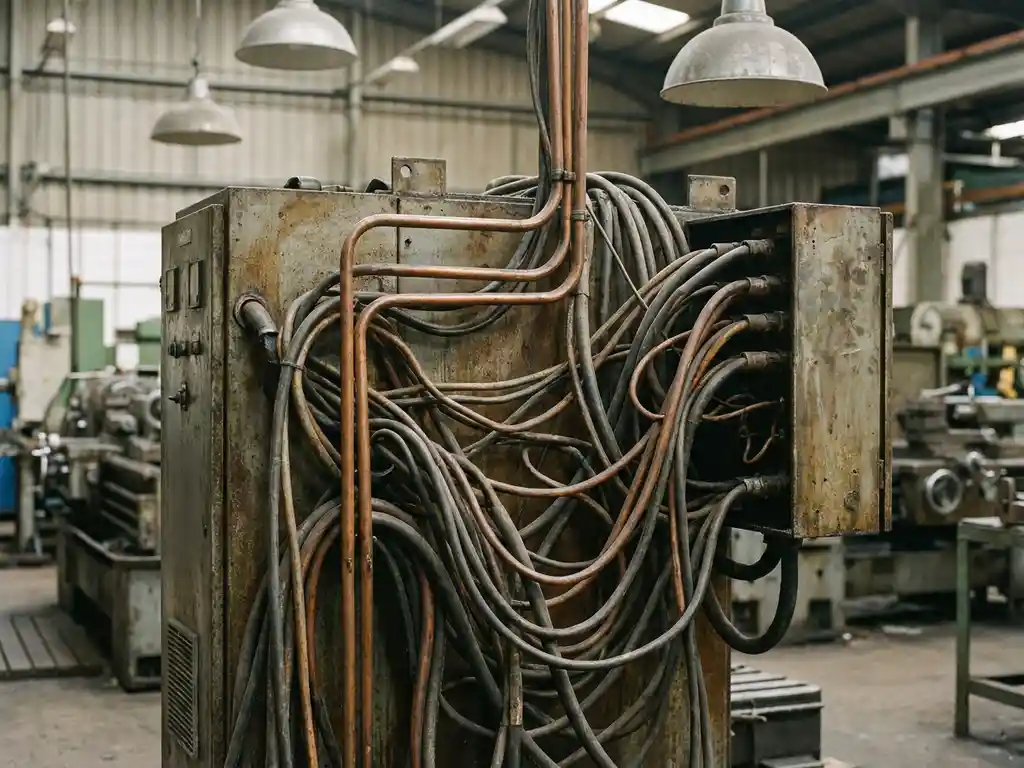
OT data is the machine-generated operational data produced by physical equipment and industrial control systems — think sensors on a production line, SCADA systems managing an energy grid, or MES platforms tracking manufacturing output. Unlike the business data flowing through your CRM or ERP, OT data describes the physical world in real time: temperatures, pressures, flow rates, machine states, and cycle counts. It is hard to use because it was never designed to leave the factory floor — it was built for control, not for analysis. The sections below unpack exactly where it comes from, why it behaves so differently from IT data, and what it takes to make it genuinely useful in a modern data platform.
Where does OT data actually come from?
OT data originates from the physical layer of industrial operations — the machines, sensors, and control systems that run factories, energy plants, and agricultural facilities. The primary sources are PLCs (Programmable Logic Controllers), SCADA systems, DCS platforms, IoT sensors, and historian databases that store time-series measurements from all of the above. Each of these systems generates a continuous stream of readings about the state of physical equipment.
In a manufacturing environment, a single production line might have hundreds of sensors measuring vibration, temperature, pressure, and throughput every few seconds. A SCADA system aggregates those readings and uses them to control the process in real time. A historian database — tools like OSIsoft PI or Honeywell Uniformance are common examples — then archives those readings at high frequency for later retrieval. In energy and agritech, the same pattern holds: wind turbines, irrigation systems, and processing equipment all generate dense, high-frequency operational data through similar architectures.
The key point is that OT data is born at the edge, close to physical processes, and is collected by systems whose primary job is control and safety — not data sharing or analysis.
How is OT data different from IT data?
OT data differs from IT data in four fundamental ways: its frequency, its structure, its purpose, and the systems that produce it. IT data — transactions, user events, CRM records — is typically event-driven, relatively low-frequency, and structured for business logic. OT data is continuous, extremely high-frequency, and structured for machine control rather than human analysis.
A database record in your ERP might be created once per order. A temperature sensor on a compressor might write a new value every 100 milliseconds. This means OT data volumes can be enormous, and the time dimension is everything — a reading is only meaningful when you know exactly when it was taken and in what operational context.
OT data also uses domain-specific formats and protocols that most IT infrastructure does not natively understand. Modbus, OPC-UA, MQTT, and DNP3 are common OT communication protocols. These are not REST APIs or SQL tables. They require specialist knowledge to read, translate, and ingest correctly. Finally, OT systems are designed with reliability and safety as the top priority — not interoperability. That design philosophy creates significant barriers when you try to connect them to a modern data platform.
Why is OT data so hard to access and collect?
OT data is hard to access because OT systems were designed to be isolated. Industrial control systems operate in air-gapped or heavily segmented networks for good reason: a cyberattack on a SCADA system can cause physical damage or safety incidents. That security posture, while necessary, makes it genuinely difficult to extract data without introducing risk to the operational environment.
Beyond the network barrier, the hardware itself creates friction. Many OT assets are decades old and run proprietary firmware that does not support modern data export methods. Even newer equipment often uses vendor-specific protocols that require licensed middleware or physical gateways to bridge into an IT-readable format. Setting up an OPC-UA server or deploying an edge gateway takes time, domain expertise, and coordination with both IT and OT teams, who often have different priorities and reporting lines.
There is also a cultural dimension. OT engineers are responsible for uptime and safety. Any change to a running system — including adding a data tap — is a risk they are understandably cautious about. Getting access to OT data therefore requires building trust with the people who own those systems, not just solving a technical problem.
What causes OT data quality problems?
OT data quality problems stem from three main sources: sensor faults, context loss during ingestion, and inconsistent timestamping. Sensors drift, fail intermittently, or get physically damaged without anyone immediately noticing. A temperature probe that reads two degrees high for a month will quietly corrupt every analysis built on that signal until someone investigates an anomaly downstream.
Context loss happens when raw sensor values are extracted without the metadata needed to interpret them. A reading of 47.3 means nothing without knowing the unit of measure, the asset it came from, the operating mode at the time, and whether the equipment was in a normal run state or a maintenance cycle. Many ingestion pipelines capture the number but drop the context, leaving data engineers to reconstruct meaning later — if they can at all.
Timestamping is a particularly subtle problem. OT systems often use their own internal clocks, which may not be synchronized to a common time source. When you merge data from multiple PLCs or historian databases, even small clock discrepancies create misaligned time series that produce misleading correlations. In high-frequency data, a one-second offset can make two related events look causally unconnected.
How do companies typically integrate OT data with IT systems?
Most companies integrate OT data with IT systems through one of three approaches: direct historian integration, edge computing with message brokers, or purpose-built OT-IT middleware platforms. The right choice depends on data volume, latency requirements, and the age of the OT infrastructure involved. At Itility, our software and data services cover all three integration patterns, helping industrial organizations move from raw sensor streams to trusted, analytics-ready data.
Historian integration
The most common starting point is connecting directly to a historian database like OSIsoft PI or Aveva. Historians already aggregate data from PLCs and SCADA systems, so they act as a convenient bridge. Data engineering teams build connectors that pull time-series data from the historian into a cloud data platform on a scheduled or near-real-time basis. This approach works well when the historian is already well-maintained, but it inherits any quality or coverage gaps in the historian’s own configuration.
Edge computing and message brokers
A more modern approach uses edge devices deployed close to the machines to collect raw sensor data and publish it to a message broker like MQTT or Apache Kafka. From there, the data flows into a streaming pipeline and lands in the data platform with low latency. This architecture gives you more control over what data is collected and how it is structured, but it requires more engineering investment upfront and careful coordination with OT teams to deploy edge hardware safely. Keeping those pipelines reliable over time is where managed services can take significant operational burden off your internal teams.
What does good OT data look like in a modern data platform?
Good OT data in a modern data platform is contextualized, timestamped consistently, quality-checked at ingestion, and linked to asset metadata so that any analyst or ML engineer can understand what a value means without needing to ask an OT specialist. It is stored in a time-series-friendly format, partitioned for efficient querying, and documented in a data catalog with clear ownership.
In practice, this means raw sensor readings are enriched with asset hierarchy information — which machine, which line, which plant — before they land in the platform. Quality flags are applied automatically to flag readings that fall outside physically plausible ranges or that come from sensors with known issues. Pipelines have built-in observability so that a broken feed triggers an alert before a data consumer notices a gap.
This is exactly the kind of OT-IT integration work we do at Itility — building the pipelines, quality checks, and governance structures that turn raw historian exports and sensor streams into a reliable foundation for analytics and machine learning. If your team is spending more time firefighting broken feeds than delivering insights, talk to us about your data platform. The gap between raw OT data and trusted, usable data is an engineering problem, and it is a solvable one.
Frequently Asked Questions
How do we decide which OT data to prioritize collecting first?
Start by mapping your highest-value use cases — predictive maintenance, energy efficiency, or yield optimization — and work backwards to identify which signals are required to support them. Focus on assets where unplanned downtime or process variation has the greatest financial impact, since that is where the ROI on OT data integration is easiest to justify. Avoid the temptation to collect everything at once; a narrow, well-contextualized dataset from one production line is far more useful than a broad, poorly understood stream from an entire facility.
What is the biggest mistake teams make when starting an OT data project?
The most common mistake is treating OT data integration as a purely technical problem and underestimating the organizational and cultural dimension. Teams often build a connector to a historian, pull raw values into a data lake, and then discover that no one can interpret the data without an OT engineer in the room. Investing early in asset metadata, naming conventions, and documentation — and involving OT specialists in the design of the pipeline, not just the access phase — prevents months of rework downstream.
How do we handle OT data from legacy equipment that has no digital output at all?
For equipment with no native digital output, retrofitting IoT sensors is often the most practical path. Vibration sensors, current clamps, and vision-based monitoring systems can be attached externally to legacy machines without modifying the underlying control system, which keeps the OT team’s risk exposure low. The data from these add-on sensors is then collected by an edge gateway and fed into the same pipeline architecture used for modern equipment, allowing legacy and new assets to be analyzed side by side in the same platform.
What is the difference between a data historian and a time-series database, and does it matter?
A historian like OSIsoft PI or Aveva is purpose-built for industrial OT environments — it handles OT protocols natively, stores compressed time-series data efficiently, and is designed to run reliably in operational settings. A modern time-series database like InfluxDB or TimescaleDB is more flexible and IT-friendly but requires additional middleware to connect to OT sources. In practice, most mature OT environments already have a historian in place, so the practical question is not which to choose but how to get data out of the historian and into your analytics platform reliably and with full context preserved.
How do we keep OT data pipelines secure without disrupting operational systems?
The standard approach is to extract data in a read-only, one-directional flow from the OT network to the IT network, typically through a demilitarized zone (DMZ) or a data diode that physically prevents any traffic from flowing back toward the OT environment. Edge gateways or historian connectors sit on the OT side of that boundary and push data out without exposing the control systems to inbound connections. Any changes to this architecture should be reviewed jointly by IT security and OT engineering teams before deployment, and penetration testing should be scoped to the integration layer only — never the live OT environment.
At what point does it make sense to move from batch ingestion to real-time streaming for OT data?
Batch ingestion is sufficient when your use cases are retrospective — reporting, trend analysis, or model training — and a latency of minutes to hours is acceptable. The shift to real-time streaming becomes necessary when you need to trigger automated actions or alerts based on live machine state, such as shutting down a pump when a pressure threshold is breached or feeding a real-time anomaly detection model. Keep in mind that streaming architectures are significantly more complex to build and operate, so it is worth validating that your use case genuinely requires low latency before investing in that infrastructure.
How do we measure whether our OT data integration is actually working well?
Track four key indicators: data completeness (what percentage of expected readings are actually arriving), latency (how long it takes a sensor reading to reach the analytics platform), quality flag rates (how often automated checks flag readings as suspect), and pipeline uptime (how frequently feeds go silent without a corresponding planned shutdown). These metrics should be visible in a monitoring dashboard and reviewed regularly by both the data engineering team and OT stakeholders. If your quality flag rate is consistently above 5% on a given asset, that is a signal to investigate the sensor, the ingestion configuration, or the quality rule itself.